Managerial Accounting (Accounting 2020 | Weber State)
Table of Contents
[[#Introduction]]
[[#Cost Concepts]]
[[#Job Order Costing]]
[[#Cost Volume Profit-Analysis (CVP)]]
[[#Activity Based Costing]]
[[#Budgeting]]
[[#Variance and Standards]]
[[#Short-Term Decision Making]]
Introduction
[[#Table of Contents]]
Accounting Overview
- Accounting: Recording, estimating, organizing, and summarizing financial information.
- Financial Accounting: Reporting to external parties (investors, lenders) using GAAP/IFRS. It is company-wide, precise, and verifiable.
- Managerial Accounting: Provides information to internal users for planning, controlling, and decision-making. It is not mandatory, uses segment reports, and relies on timely, credible judgments, assumptions, and estimates.
Key Functions
- Planning: Establishing goals and developing plans to achieve them.
- Budget: A plan for the future expressed in quantitative terms.
- Controlling: Ensuring the plan is correctly executed by gathering, evaluating, and responding to feedback.
- Performance Report: Compares budgeted data to actual data.
- Decision Making: Selecting a course of action from competing alternatives. It is the most fundamental managerial skill.
Types of Firms
- Retail: Reselling products.
- Service: Providing actions or services.
- Manufacturing: Transforming materials into finished products.
Managerial vs. Financial vs. Tax Accounting
| Aspect | Managerial Accounting | Financial Accounting | Tax Accounting |
|---|---|---|---|
| Requirement | Not mandatory | Required by law | Required by law |
| Users | Internal | External (investors, lenders) | IRS |
| Rules | Best practices | GAAP | Tax Code |
| Time Focus | Past, present, and future | Past | Past |
Key Concepts
- Goal of a Firm: Maximize wealth by maximizing economic profit.
- Opportunity Cost: The benefit forgone by choosing one action over another.
- Sunk Cost: A cost that has already been incurred and cannot be recovered. It should not affect current decisions.
Ethics and Professional Standards (IMA)
- Competence: Maintain professional knowledge, perform duties in accordance with standards, provide accurate and supported information.
- Confidentiality: Do not disclose confidential information, avoid using information for unethical advantage.
- Integrity: Mitigate conflicts of interest, avoid prejudice, avoid discrediting the profession.
- Credibility: Communicate fairly and objectively, disclose all relevant information.
Enterprise Risk Management
- Preventative Controls: Stop harm before it occurs (e.g., authorization, segregation of duties).
- Detective Controls: Detect harm after it occurs (e.g., reconciliation, performance reviews).
Strategy
- Customer Intimacy: Customizing products to fit specific needs.
- Operational Excellence: Providing faster, more convenient, and affordable products.
- Product Leadership: Offering superior products.
Big Data
- 5 V's:
- Variety: Different formats of data.
- Volume: Size or amount of data.
- Velocity: Rate at which data is received and acted upon.
- Value: Resources used to analyze data.
- Veracity: Accuracy of data.
Cost Concepts
[[#Table of Contents]]
Cost Classifications
- Cost Object: Anything for which cost data is desired (e.g., products, departments).
- Direct Cost: Easily traced to a cost object (e.g., direct materials, direct labor).
- Indirect Cost: Not easily traced to a cost object (e.g., manufacturing overhead).
- Common Cost: A cost that supports multiple cost objects.
Manufacturing Costs
- Direct Materials (DM): Raw materials that become part of the finished product.
- Direct Labor (DL): Labor costs directly associated with production.
- Manufacturing Overhead (MOH): All other manufacturing costs (indirect materials, indirect labor, depreciation, utilities, etc.).
- Product Cost: DM + DL + MOH (inventoriable costs).
- Prime Cost: DM + DL.
- Conversion Cost: DL + MOH (costs to convert materials into finished products).
Period Costs
- Selling Costs: Costs incurred to secure customers (e.g., advertising, sales commissions).
- Administrative Costs: General management costs (e.g., executive salaries, office supplies).
- General Costs: Any other non-manufacturing costs.
Cost Behavior
- Variable Cost: Changes in proportion to changes in activity level.
- Fixed Cost: Remains constant regardless of activity level.
- Committed Fixed Costs: Long-term, multiyear commitments (e.g., depreciation).
- Discretionary Fixed Costs: Short-term, annual or less (e.g., advertising).
- Mixed Cost: Contains both variable and fixed elements.
- Relevant Range: The range of activity where cost behavior is linear.
- Irrelevant Range: The range where cost behavior is non-linear.
Decision-Making Concepts
- Differential Cost: Difference in cost between two alternatives.
- Differential Revenue: Difference in revenue between two alternatives.
- Incremental Cost: Additional cost incurred by producing one more unit.
- Opportunity Cost: Potential benefit given up when one alternative is chosen over another.
- Sunk Cost: Cost that has already been incurred and cannot be recovered.
Income Statement Formats
| Traditional Income Statement | Contribution Margin Income Statement |
|---|---|
| Revenues | Revenues |
| - COGS | - Variable Costs (product and period) |
| Gross Margin | Contribution Margin |
| - SG&A | - Fixed Costs |
| Pre-Tax Income | Pre-Tax Income |
Traditional Income Statement
Contribution Income Statement
- Contribution Margin: The amount remaining from sales after covering all variable expenses. It contributes toward covering fixed costs and generating profit.
Cost Estimation
- High-Low Method: Used to estimate fixed and variable costs.
- Total Cost Equation:
Manufacturing Cost Flows
- Raw Materials (RM): Warehouse inventory.
- Work in Process (WIP): Factory inventory where products are being manufactured.
- Direct materials are transferred from RM to WIP.
- Direct labor and MOH are added to WIP.
- Cost of Goods Manufactured (COGM): Cost of completed goods transferred from WIP to Finished Goods.
- Finished Goods (FG): Inventory of completed products ready for sale.
- Cost of Goods Sold (COGS): Cost of goods sold to customers.
T-Accounts
- Key Equation:
- Key Accounts:
- Cash
- Raw Materials (RM)
- Work in Process (WIP)
- Finished Goods (FG)
- Cost of Goods Sold (COGS)
- MOH Reconciliation
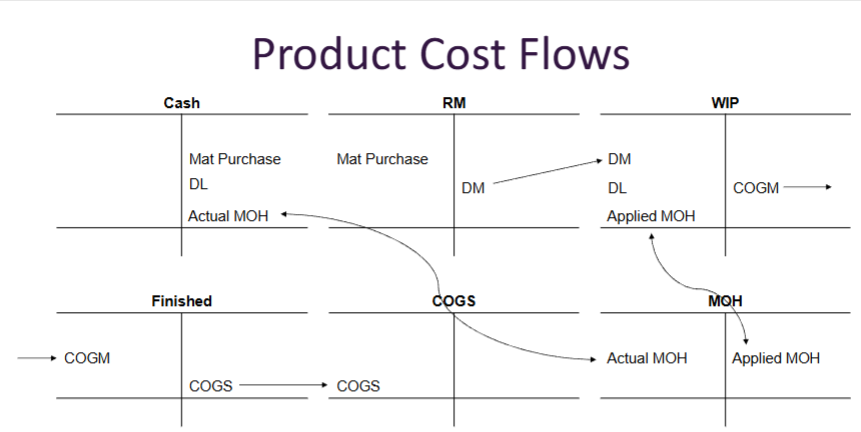
| Cash | Raw Materials | (Warehouse) | Work In Progress | (Factory) | Finished Goods | (Store) | Cost Of Goods Sold | Manufacturing Overhead | ||||||||
|---|---|---|---|---|---|---|---|---|---|---|---|---|---|---|---|---|
| Dr | Cr | Dr | Cr | Dr | Cr | Dr | Cr | Dr | Cr | Dr | Cr | |||||
| Material Purchases | Material Purchases | Direct Materials | Cost of Goods Manufactured | Cost of Goods Sold | Actual MOH | Applied MOH | ||||||||||
| Direct Labor | Direct Materials | Direct Labor | Cost of Goods Manufactured | Cost of Goods Sold | ||||||||||||
| Actual MOH | Applied MOH | |||||||||||||||
| Total | Total | Total | Total | Total | Total |
Estimating Manufacturing Overhead (MOH)
- Predetermined Overhead Rate:
- Applied MOH:
- Actual MOH: The real MOH cost incurred during the period.
- Underapplied MOH: When actual MOH exceeds applied MOH.
- Overapplied MOH: When applied MOH exceeds actual MOH.
- Move to COGS:
- Overapplied: Dr MOH, Cr COGS
- Underapplied: Cr MOH, Dr COGS
- Prorate method:
- Use ending balances
- divide each by total for percent
- Times percent by reconciliation
- divide each by total for percent
- To WIP, FG, and COGS
- Use Ending Balance pre-adjustment
- Overapplied: Dr MOH, Cr WIP, FG, COGS proportionally
- Underapplied: Cr MOH, Dr WIP, FG, COGS proportionally
- Use ending balances
Job Order Costing
[[#Table of Contents]]
Overview
- Used by manufacturing firms that produce custom or unique products for specific customers.
- Costs are accumulated by job.
- Suitable for firms producing a few goods for a few customers.
Cost Accumulation
- Direct Materials (DM): Traced directly to each job.
- Direct Labor (DL): Calculated as:
- Manufacturing Overhead (MOH): Applied to jobs using a predetermined overhead rate based on a cost driver (e.g., machine hours, labor hours).
Departmental Overhead Rates
- Overhead costs can be broken down by departments.
- Each department may have its own cost driver and predetermined overhead rate.
- Total applied MOH is the sum of applied MOH from all departments.
Economies of Scale
- Decreasing average total cost as production volume increases.
- Contribution Margin per Unit:
Cost Volume Profit-Analysis (CVP)
[[#Table of Contents]]
What if?
Goal: Maximize Economic Profit
$$ \text{Contribution Margin per Unit} = \text{Price} - \text{Variable Cost per Unit} $$
$$Profit = (P \times Units) - Fixed + (Variable \times Units)$$
$$Profit = Units \times (P - VC) - FC$$
- Use to find break even point
$$\text{Contribution Margin Ratio} = \frac{P-VC}{P}$$
- The amount that goes toward fixed cost
= Amount that goes toward variable cost
$$Profit = (Rev \times CMR) - FC $$
Margin of Safety
$$ \text{Safety Margin} = \text{Revenue
} - \text{Break Even Revenue}$$
Operating Leverage
$$\text{Operating Leverage} = \frac{\text{Total Contribution Margin}}{Net Income} $$
- High: lots of fixed costs
- Specific to time period
Activity Based Costing
[[#Table of Contents]]
When?
- Lots of product diversity
- Costs are not unit-level
- Complex manufacturing process (high overhead cost)
- Low data processing cost (collecting and using)
- Some products have a higher margin
- Actions do not seem to align with competitors
- Line managers no not believe costs
- Complex products are very profitable but not priced at a premium
When the benefits outweigh the costs
- Costs:
- More complex calculation
- More complex data collection
- Change of culture
- Benefits
- More accurate costing
- Better ability to properly set prices - especially when costs are large
Cost Pool: Uses it's own cost driver and rate
Can be used for only MOH or applied to SG&A
- What are they using it for?
Guide to Activity Based Costing
- Define Activities and Identify cost driver (drivers are unique)
- Assign budgeted costs to cost pool and calculate budgeted cost driver
- Calculate budgeted rate
- Assign cost (applied ABC)
$$ \text{Activity Rate} = \frac{\text{Budgeted Cost}}{\text{Budgeted Driver}}$$
How do costs vary depending on cost drivers?
- Units
- Hours
- Customers
- Batches
- Products
First stage allocation
- Assign all costs to different pools (Budgeted Cost)
- Does not need all product costs
- Assign an Activity Measure (Budgeted driver)
- Correlated with cost
- Easy to measure accurately
Budgeting
Planning Budget
Flexible Budget- Reworking the planning budget to the actual level of sales
- Budgets may not be the same
- Actual Units
Standard Costs and Usages
Actual Budget - Actual Units
Actual Costs and Usages
Plan
- Developing goals and preparing budgets to achieve those goals
- Make goals
- Plan how to meet goals
- How to allocate scare resources
- Foresee problems
Control - Gathering feedback to ensure that the plan is being properly executed or modified as circumstances change
- Coordinate across divisions
- Create evaluation benchmarks
Perpetual budget: Creating a budget that rolls forward as it's completed
How
Top-Down
- Top managers set budgets - Big picture
- Advantages
- Sets expectations
- Can push lower management to improve
- Often improves coordination
- Disadvantages
- May not get "buy-in"
Bottom-Up (Participative)
- May not get "buy-in"
- Lower managers set budgets, then all are compiled
- Advantages
- Buy-in
- More Accurate
- Disadvantages
- "Slack" (easy goals)
Cost Function:
Avoid
- Too Easy
- Too Hard
- Conflicting Goals
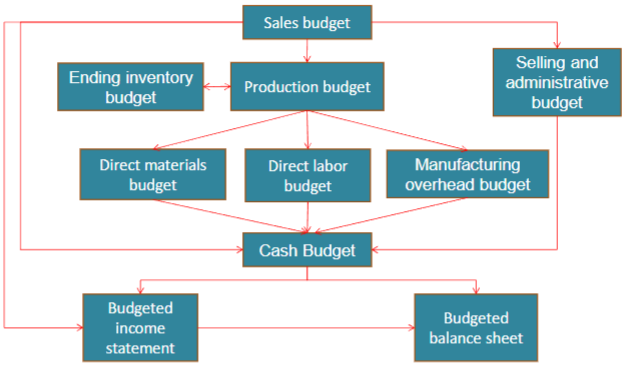
Production Budget
- Goal: How many units to make
- Selling
- Ending FG
- (Beg FG)
DM (Material Purchase) - Using
- Ending RM
- (Beg RM)
DL - Using
- Overtime
MOH - Based on cost driver
Cash Budget
- Beginning Cash
- +Cash In
- Cash Available
- (Dispersements)
- Net Cash
- +Loan
- Ending Cash
Income Statement: Units to sell (not to make)
- Cash flows are what's made
Variance and Standards
[[#Table of Contents]]
Budgets as a control
- Beyond planning, budgets are used to verify that goals are met
- Compare results to plan
- Explain why they differ to make better future plans
Variances
Documentation of differences between budgets and results
- Always a positive number (labeled as Favorable - F, or Unfavorable - U)
Activity Variance: Difference in sales output
- Planning - Flexible
- Cross out Actual
- Memorize: Activity ignores Actual
Spending Variance: Difference in cost or usage - Flexible - Actual
- Cross out Planning
- Memorize: sPending ignores Planning
Favorable: Lower cost (or cost driver) or higher revenue
Unfavorable: Higher cost (or cost driver) or lower revenue
Standards
- What should go into making a product
- Standard Usage: Unit Quantity of material, labor, machine hours, etc.
- ? / Unit
- Production
- Standard Cost: Cost of one unit of what is being used (1 pound, 1 hour, etc.)
- $ / Unit
- Purchasing
Standard UsageStandard Cost = $ / Unit
Ideal Standards (perfect)
- Pushes managers to improve
- Standards will likely not be met
Normal Standards (average) - Attainable
- May not lead to fast improvements
All standards come from past data
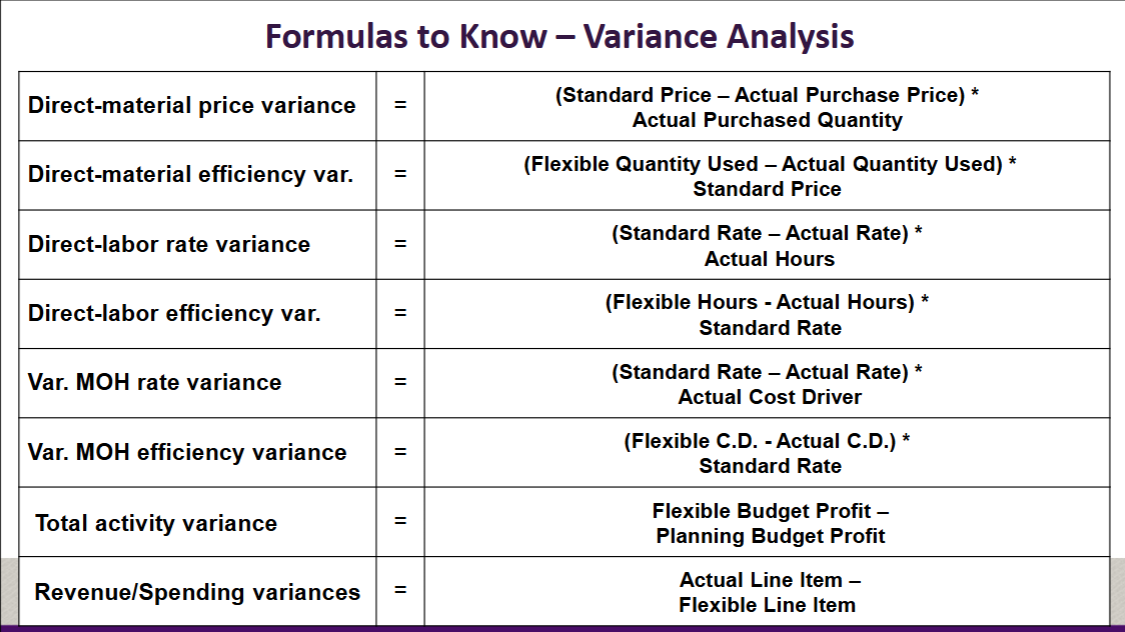
Efficiency and Price Variance
Efficiency Variance = (Actual Usage - Flexible Usage)
- Standards come from planning budget
Price Variance = (Standard Price - Actual Price)Actual Purchases - Price per unit
- Purchases will not always equal usage
Efficiency Variance + Price Variance = Total (DM, DL, etc.) Variance
Total ( ) Variance = Spending Variance
Standard Quantity
$$Units \times \text{Quantity per Unit} $$
Standard Cost
$$\text{Standard Quantity} \times \text{Standard price} $$
Spending Variance
$$\text{Actual Cost} - \text{Standard Cost} $$
- Favorable if Standard > Actual
- Also called cost variance
Cost Variance
$$(\text{Actual Price} - \text{Standard price}) \times \text{Actual Quantity} $$
- Favorable if Standard > Actual
Efficiency Variance
$$\text{Actual Quantity} - \text{Standard Quantity} $$
- Favorable if Standard > Actual
- Also called Material Quantity Variance
Chapter 7 - Activity Based Costing
[[#Activity Based Costing]]
ABC Costing
- When to use ABC vs Plant-Wide rates
Calculate Activity Rates
- ABC
- Traditional
- First Stage Allocation (cost / driver)
- Getting the $ into the pool
- Second Stage Allocation (jobs / product)
Rate = Cost / Driver
ABC Rate = What changes / The thing that changes it
Chapter 8 - Budgeting
[[#Budgeting]]
What is the goal of the budget?
Why Budget
- Planning and Control
How - Top Down
- Participative Budgeting
- Pros and Cons
Production Budgets
- Units to Manufacture
- DM to Purchase
- DL to Purchase
- Variable MOH Expected Expense
Flow of Budgets
- Sales Forecast to Revenue Budget
- Revenue to Purchases Budget (or Production Budget)
- Cash Budget
Planning Budget (Income Statement)
Chapter 9 - Flexible Budgets
Making a Flexible Budget
- Actual
Standards
Creating Standards
- Ideal vs. Practical (Ch. 10)
- Standards may use cost functions (TC = FC + VC * Activity Measure)
Activity Variance
- Planning vs Flexible
Spending Variance (Revenue)
- Actual and Flexible
Chapter 10 - Standards
Spending Variances
Price and Efficiency (Volume) Variances
- Direct Labor, Direct Materials, Var. MOH
- Remember inventory issues for DM
- Know how to calculate and interpret variances
Workout: Forward Multiple Choice: Backward
Is the spending variance due to price or quantity
- Line by line
Formulas
Short-Term Decision Making
[[#Table of Contents]]
Forecasting is an Art.
Mechanics of Decisions is a Science (focus of chapter).
Good Decisions
- Identify Options
- Forecast Consequences
- Make Profit Maximizing Choice
- Watch out for Constrained Resources
Everything Method
- Identify All Costs and Benefits to each option
- "Pro-forma" (budgeted) income statements
- Choose the biggest Income (lowest cost)
- Pro: Already have income statement
- Con: Includes less relevant data
**Relevant Cost and Benefit Method
(Method used in class)
- Identify Options.
- Dismiss Irrelevant costs and benefits.
- Good Idea to keep variable costs to give an accurate Contribution Margin
- Identify relevant (differential) costs and benefits of each option.
- Pick profit-maximizing option.
- Identify net benefit.
- Pro: Cannot always get projected income statement, Including irrelevant costs may distract.
- Cons: May not give the full picture, even if the decision is the same.
- Better to include irrelevant info than disregard relevant info.
Relevant: a result of choosing an option
- Best to examine what changes
- Opportunity cost is relevant
Irrelevant: Anything that stays the same with all options
- Sunk costs is generally irrelevant
- Fixed costs may be irrelevant
Capital Budgeting
Tax savings due to depreciation
- In Class: Straight Line Depreciation and Single Tax Rate
- In reality: MACRS (accelerated) depreciation and Graduated tax rates (incremental tax brackets)
Profitability Index
Financial Statement Analysis
- Compare data within a company over time
- Compare data across companies
Garbage In, Garbage Out
Ratios
- Valuable, but often don't tell the entire story
Analysis
Vertical Analysis (Apples to Apples)
Change everything to percentages
- Balance Sheet = % of Assets, Liabilities, Equity
- Income Statement = % of Revenues
Horizontal Analysis (Timeline)
Look at the company though time
Change everything to